Crypto Fibonacci Retracement Guide: Master the Golden Ratio in Trading
Fibonacci retracement levels are among the most widely used technical analysis tools in cryptocurrency trading, and for good reason. The mathematical relationship underlying Fibonacci sequences appears throughout nature, art, and architecture, and financial markets have long demonstrated an apparent affinity for these same ratios. Whether you view this as evidence of universal mathematical principles governing market behavior or simply as a self-fulfilling prophecy driven by millions of traders watching the same levels, the practical reality is that Fibonacci levels function as real support and resistance in crypto markets. Understanding how to draw, interpret, and trade these levels gives you a meaningful edge in your technical analysis toolkit.
The Mathematics Behind Fibonacci
The Fibonacci sequence begins with zero and one, and each subsequent number equals the sum of the two preceding numbers. This creates the familiar sequence: zero, one, one, two, three, five, eight, thirteen, twenty-one, thirty-four, fifty-five, eighty-nine, one hundred forty-four, and so on into infinity. What makes this sequence mathematically interesting is the relationship between consecutive Fibonacci numbers, which converges toward the golden ratio of approximately one point six one eight as the numbers increase.
The golden ratio has fascinated mathematicians for centuries because of its unique properties. A line divided at the golden ratio produces a ratio where the whole length divided by the longer segment equals the longer segment divided by the shorter segment. This same ratio appears in the spirals of nautilus shells, the branching patterns of trees, the proportions of the Parthenon, and Leonardo da Vinci's Vitruvian Man. The aesthetic appeal of golden ratio proportions has influenced art and architecture for millennia.
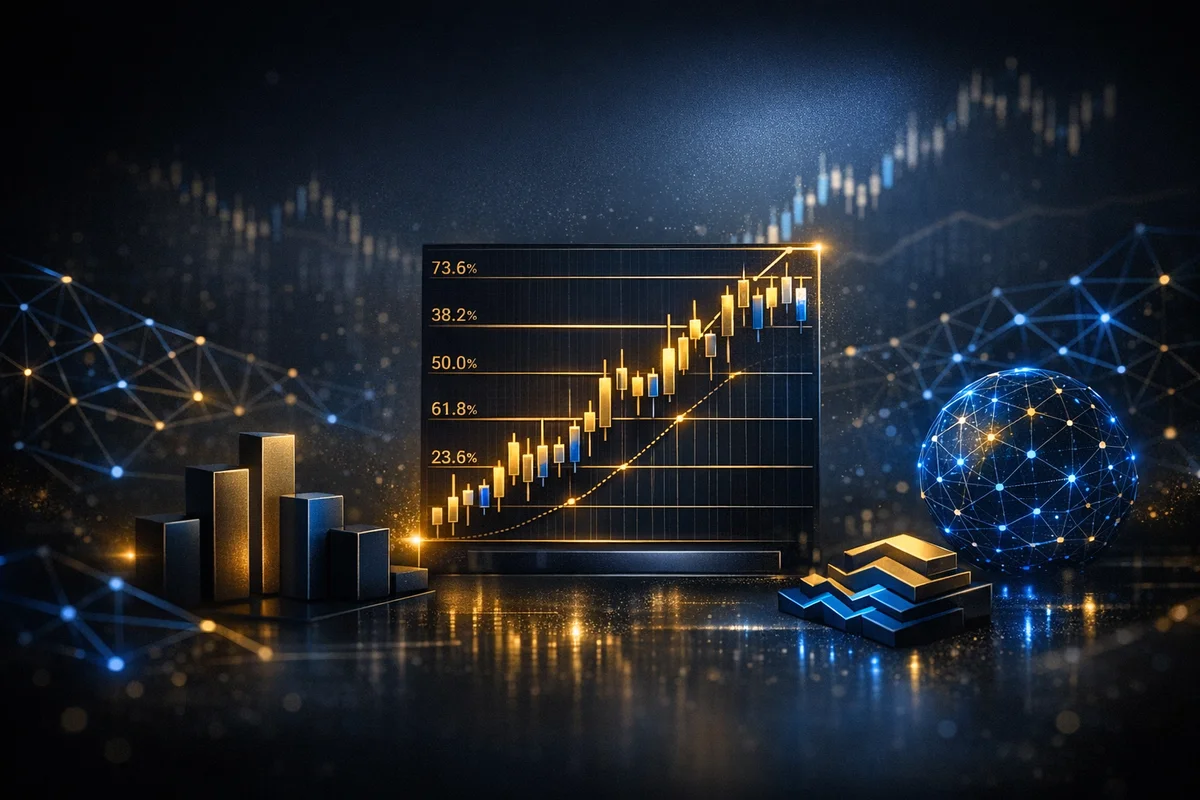
In financial markets, technical analysts apply these ratios to price charts by measuring the size of a price move and then identifying potential reversal levels at the key Fibonacci percentages of that move. The most important retracement levels are twenty-three point six percent, thirty-eight point two percent, fifty percent, sixty-one point eight percent, and seventy-eight point six percent. Each of these levels represents a mathematical relationship derived from the Fibonacci sequence, and markets tend to respect these levels with surprising frequency.
The twenty-three point six level comes from dividing a Fibonacci number by the number three places to its right in the sequence. The thirty-eight point two level emerges from dividing a number by the number two places to its right. The fifty percent level is not technically a Fibonacci number but is included based on the observation that markets frequently retrace half of their prior move. The sixty-one point eight level is the inverse of the golden ratio, representing the point where the golden ratio divides a move. The seventy-eight point six level derives from the square root of the golden ratio.
How to Draw Fibonacci Retracement Levels
Proper drawing technique separates traders who consistently identify high-probability trade setups from those who produce noise and confusion. The first step is selecting an appropriate swing to measure. In an uptrend, you measure from the swing low to the swing high. In a downtrend, you measure from the swing high to the swing low. The key is identifying significant, clear swing points that represent meaningful trend changes rather than minor pullbacks within a larger move.
When identifying swing points, focus on the most obvious pivots where price clearly reversed direction. In Bitcoin's weekly chart, these typically correspond to major trend changes at cycle highs and lows. On daily charts, they represent the start of new impulse moves after consolidation. On intraday charts, they identify directional moves with enough distance to provide meaningful retracement levels. The general rule is that larger swings produce more reliable Fibonacci levels because more market participants are aware of them and watching for reactions.
To draw Fibonacci retracement levels, select your drawing tool and click at the starting point of the move, then drag to the ending point. Most charting platforms will automatically display the key levels with their corresponding price levels and percentage distances. The direction of your draw determines whether the levels represent potential support on pullbacks in an uptrend or potential resistance on rallies in a downtrend. Some traders prefer to always draw from left to right in the direction of the trend, while others draw in both directions to identify all relevant levels regardless of trend direction.
Multiple time frame analysis dramatically improves the reliability of Fibonacci levels. When the thirty-eight point two percent retracement of a weekly swing aligns with the sixty-one point eight percent retracement of a daily swing, that price level commands significantly more attention than either level alone. The convergence of Fibonacci levels across time frames creates zones of strong support or resistance where the probability of reversal increases substantially. This principle of level confluence is one of the most powerful applications of Fibonacci analysis.
Key Fibonacci Levels Explained
Each Fibonacci retracement level has distinct characteristics based on the significance of the underlying mathematical relationship. Understanding why each level matters helps you prioritize your analysis and allocate your attention appropriately.
The twenty-three point six retracement represents the shallowest common pullback level. Moves that retrace only twenty-three percent typically indicate extremely strong momentum, and these shallow pullbacks are common in the early stages of parabolic advances or during trending moves with minimal selling pressure. Price tends to spend less time at this level and can move through it quickly if the retracement is going to extend deeper. Trading solely at the twenty-three point six level generally produces lower win rates than trading deeper levels.
The thirty-eight point two retracement corresponds to a deep retracement that remains consistent with the continuation of the underlying trend. This level frequently appears in what Elliott Wave practitioners call a wave two or wave four correction within a larger impulse structure. When price retraces exactly thirty-eight point two percent of a prior move and bounces, it signals that the dominant trend remains intact and continuation is likely. This level produces some of the most reliable continuation setups in technical analysis.
The fifty percent level is the midpoint of any move, and while it lacks a direct Fibonacci mathematical foundation, its psychological significance makes it a meaningful support and resistance level. Markets often find equilibrium at round numbers and halfway points, and the fifty percent retracement benefits from this psychological attraction. Trading at the fifty percent level works best when confirmed by other technical factors rather than treated as a standalone Fibonacci signal.
The sixty-one point eight retracement, often called the golden ratio retracement, is perhaps the most historically significant Fibonacci level. A retracement that reaches sixty-one point eight percent of a prior move and reverses suggests the market has pulled back deeply but not so deeply as to invalidate the trend entirely. This level frequently serves as a make-or-break point for trend continuation, and its breach often signals something more significant has changed in market dynamics.
The seventy-eight point six retracement represents an extreme retracement that many technicians consider the boundary between a correction and a trend reversal. When price retraces more than seventy-eight percent of a prior move, the trend structure has been significantly damaged, and a deeper reversal becomes increasingly likely. Trading setups at this level require stronger confirmation because the risk of trend continuation is reduced and the potential reward from a full reversal is larger.
Combining Fibonacci with Other Indicators
Fibonacci levels work best not as standalone trading signals but as components of a multi-factor analysis framework. The most powerful setups occur when Fibonacci retracement levels coincide with other forms of support and resistance, trend structure, and momentum indicators.
Horizontal support and resistance levels from prior price action create powerful confluence with Fibonacci retracements. When a Fibonacci level aligns with a previous high or low, a trend line break, or a consolidation zone, the resulting support or resistance zone is significantly stronger than either factor alone. The reason is simple: traders using multiple methodologies will all be watching the same confluence zone, creating a self-reinforcing concentration of buying or selling interest at that price level.
Moving averages, particularly the fifty-day and two-hundred-day exponential moving averages, frequently interact with Fibonacci retracement levels in meaningful ways. A fifty percent Fibonacci retracement that coincides with the two-hundred-day moving average creates a zone where trend-following traders, mean-reversion traders, and Fibonacci traders are all watching the same price level. The convergence of these different analytical approaches produces high-probability trading setups.
RSI divergence at Fibonacci retracement levels adds a momentum confirmation dimension that improves trade quality. When price pulls back to a Fibonacci level while RSI shows bullish divergence, it signals that selling pressure is exhausted and a bounce is likely. This combination identifies high-probability long entries at support and short entries at resistance with momentum confirmation backing the structural level.
Volume analysis at Fibonacci levels provides insight into whether a level is likely to hold or break. When price approaches a Fibonacci retracement level on declining volume, the level is more likely to hold because the selling pressure is diminishing. When price approaches on expanding volume, the level is more likely to break because institutional sellers are actively pushing through what might otherwise be support. Monitoring volume at Fibonacci levels helps you distinguish between genuine reversals and failed tests that will continue in the direction of the original trend.
Common Fibonacci Trading Mistakes
Understanding what not to do is equally important as understanding the correct techniques. Several recurring mistakes consistently undermine the effectiveness of Fibonacci analysis for traders who have not learned to avoid them.
The most common mistake is drawing Fibonacci levels on too many swings without prioritizing the most significant ones. When you draw Fibonacci retracements on every minor pullback, you create a chart cluttered with overlapping levels that confuse rather than clarify. The solution is to identify the dominant trend swings and focus your analysis on those primary structures while ignoring the noise of smaller time frame fluctuations.
Another frequent error is treating Fibonacci levels as precise prices rather than zones. Financial markets rarely reverse exactly at the sixty-one point eight level and nowhere else. Instead, they reverse within a zone surrounding the Fibonacci level, perhaps between fifty-eight and sixty-five percent retracement. Traders who place stops too tightly based on exact Fibonacci prices frequently get stopped out before the trade works in their favor. Treat Fibonacci levels as areas of interest rather than exact lines in the sand.
Confirmation bias leads traders to ignore signals that contradict their Fibonacci analysis while overweighting signals that confirm it. If you have identified a potential long setup at the thirty-eight point two retracement, you should actively look for reasons it might not work, not reasons it will. Does RSI divergence exist at this level? Is there a major news catalyst approaching? Are macro conditions favorable for risk assets? Seeking disconfirming evidence before entering a trade protects you from the overconfidence that leads to large losses.
Failing to adjust Fibonacci levels as the chart evolves creates stale analysis that no longer reflects current market structure. When a new significant high or low forms, previous Fibonacci levels may need to be redrawn to reflect the updated structure. Outdated Fibonacci levels can actually mislead you by pointing to support or resistance that no longer represents the relevant range for current price action.
Practical Trading Applications
Applying Fibonacci retracement analysis in live trading requires establishing a clear process for identifying setups, validating them with additional factors, and managing risk appropriately. The following framework provides a structured approach that balances the opportunities Fibonacci analysis creates with the risk management discipline successful trading requires.
Begin by identifying the primary trend on your target time frame using structural analysis. In an uptrend, your bias is to look for long setups at Fibonacci support levels during pullbacks. In a downtrend, your bias is to look for short setups at Fibonacci resistance during rallies. This directional bias keeps you on the right side of the dominant trend and prevents the common mistake of fighting established momentum.
Scan for Fibonacci retracement levels where price is currently approaching or has recently reached a key level. Prioritize levels that show confluence with other technical factors. A level that aligns with a horizontal support zone, a moving average, and RSI divergence represents a substantially higher probability setup than an isolated Fibonacci level with no additional confirmation.
Wait for price action confirmation at the Fibonacci level before entering. A reversal candlestick pattern such as a hammer, engulfing bar, or morning star at a Fibonacci support level provides entry timing that improves your odds compared to simply buying because price has reached a level. The confirmation candlestick tells you that other market participants are also recognizing the support and are actively buying, which creates the momentum necessary for a sustained bounce.
Define your risk parameters before entering any trade. The stop loss should go beyond the Fibonacci zone where your thesis would be invalidated. If you are buying at the thirty-eight point two retracement, a close below the fifty percent level likely means the retracement is extending deeper and your trend continuation thesis is incorrect. Position sizing should ensure that a stop loss at that level represents no more than one to two percent of your total trading capital.
Take profits at logical target levels rather than trying to capture the entire move. A common approach is to take partial profits at the next Fibonacci level in the direction of the trend, such as the prior high in a continuation trade, while allowing a portion of your position to ride with momentum. This ensures you capture value while preserving upside participation in case the trend extends significantly beyond your initial target.
Conclusion
Fibonacci retracement levels remain one of the most valuable tools in a cryptocurrency trader's technical analysis arsenal. Their mathematical foundation, combined with their widespread recognition among market participants, creates self-reinforcing support and resistance that produces reliable trading opportunities when used correctly.
The key to successful Fibonacci trading lies not in any single level or setup but in the disciplined application of a comprehensive analytical framework. Draw levels on significant swings, prioritize confluence with other technical factors, wait for price action confirmation, and manage risk systematically. Avoid the common mistakes of over-drawing, treating levels as exact prices rather than zones, and falling prey to confirmation bias.
Like all technical analysis tools, Fibonacci retracements do not produce perfect predictions. Markets will sometimes blow right through even the most perfectly drawn Fibonacci level. The goal is not to achieve a perfect success rate but to develop an edge that, applied consistently over many trades, produces positive expected returns. When combined with proper position sizing, risk management, and trade psychology, Fibonacci analysis contributes meaningfully to a comprehensive trading approach that can generate consistent results in cryptocurrency markets.
Frequently Asked Questions
Q: What are Fibonacci retracement levels in crypto trading?
Fibonacci retracement levels are horizontal lines at key percentages — 23.6%, 38.2%, 50%, 61.8%, and 78.6% — derived from the Fibonacci sequence that act as potential support and resistance zones during price pullbacks.
Q: How do you use Fibonacci retracement in crypto trading?
Identify a significant price swing from low to high, then draw retracement levels between those points — price often bounces at these levels during pullbacks, with the 61.8% golden ratio level being historically the most significant.
Q: Why do Fibonacci levels work in crypto markets?
Fibonacci levels work because many traders use them, creating self-reinforcing price reactions at the same levels — classic technical analysis works as a leading indicator only when enough participants believe in it.
Q: What are the limitations of Fibonacci trading strategies?
Fibonacci levels are not guaranteed to work — they fail regularly, especially in strong trending markets or during black swan events. Always confirm signals with volume, other technical indicators, and sound risk management.